foobar2000:Components/Spectrum Analyzer (foo_vis_spectrum_analyzer)
| Spectrum Analyzer | |
|---|---|
 | |
| Developer(s) | |
| Repository | Github |
| Release information | |
| Stable release | 0.6.0.3 (January 13, 2024; 0 years ago) |
| Preview release | 0.1.0.0 (November 12, 2023; 1 year ago) |
| foobar2000 compatibility | |
| Architecture | x86 32-bit, x86 64-bit |
| Minimum version | 2.0 |
| UI module(s) | Default UI |
| Additional information | |
| Use | Visualization |
| View all components | |
A recreation of Musical Spectrum component for foobar2000 v2.x and 64-bit versions.
You can double-click the component window to switch between windowed and full-screen mode.
Contents
Configuration
Right-click on the component window to display the context menu.
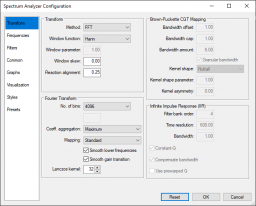
Select Configure from the context menu to open the configuration dialog.
Transform
Method
Allows you to select the Time to Frequency domain transform. Currently Fast Fourier (FFT) and Constant-Q (CQT) transforms are implemented.
Window Function
Selects the window function that will be applied to the Time data.
Window Parameter
Allows you to tweak window functions that support a parameter.
Window Skew
Skew factor for the window function.
Channels
Allows you to select that audio channels that will be used to calculate the transform.
FFT
Groups the parameters that influence the Fast Fourier transform.
FFT Size
Specifies the size of the FFT window as a number between 64 and 32768.
Select Custom to specify a number that is not a power of 2. This will consume a lot more CPU power. Select Sample rate based to specify the size as a duration. F.e. 100ms of a track sampled at 44.1kHz will result in an FFT window of 4410 samples.
Summation
Determines which method is used to sum the coefficients of FFT.
   Minimum
   Maximum
   Sum
   Residual Mean Square (RMS)
   RMS Sum
   Average
   Median
Smooth lower frequencies
Smooth gain transition
Lanczos kernel
Determines the size of the Lanczos kernel. The kernel is used to create a smooth transition between the FFT coefficients resulting in a visual pleasing result.
Frequencies
Groups the parameters that determine the frequency range that will be displayed.
Distribution
Determines which parameters are used to generate the frequency bands.
   Linear: Generate frequency bands based on the frequency parameters.
   Octaves: Generate frequency bands based on the note parameters.
   AveePlayer: Generate frequency bands used by AveePlayer.
No. of bands
Specifies the number of frequency bands to generate (2 to 512) in the specified frequency range.
Frequency range
Frequency of the first and last band, 1Hz to 96000Hz.
Note range
Available when selecting the Octaves distribution. Select a range between the C note of octave 0 and B# of octave 11 (max. 144 notes or 12 octaves)
Bands per octave
Number of bands per octave (1 to 48)
Pitch
Tuning pitch (A4 = 440.0Hz), 1Hz to 96000Hz.
Transpose
Detuning offset (-24 to 24)
Scaling
Determines which frequency scaling function is used.
   Linear
   Logarithmic
   Shifted logarithmic
   Mel (AIMP)
   Bark
   Adjustable Bark
   ERB
   Cams
   Hyperbolic Sine
   Nth Root
   Negative exponential
   Period
Skew factor
Bandwidth
Determines the width of a frequency band. (0.0 to 64.0)
X axis
Groups the parameters that determine the way the X axis is displayed.
Mode
Determines which X axis to display.
   None: Hides the X axis.
   Bands: Center frequency of a band, every 10 bands.
   Decades: Fixed frequency range
   Octaves: Frequency of the C note of each octave
   Notes: C note of each octave
Y axis
Groups the parameters that determine the way the Y axis is displayed.
Mode
Determines which Y axis to display.
   Note: Hides the Y axis
   Decibel scale
   Logarithmic
Amplitude range
Determines the minimum and maximum amplitude, expressed in decibel (dB), to display.
Amplitude step
Determine the step size between the min. and max. amplitude.
Use absolute
Gamma
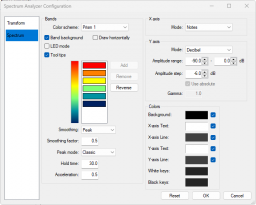
Bands
Color scheme
Specifies the color scheme used to render the spectrum.
   Solid color
   Custom
   Prism 1
   Prism 2
   Prism 3
   foobar2000
   foobar2000 Dark Mode
   Fire
Double-click a color to modify it. Modifying a color automatically selects the Custom color scheme. Press the Add' button to add a color, Remove to remove a color, Reverse to reverse the color scheme.
Band background
Enable the check box to see a background behind every band of the spectrum.
Tooltips
Enable the check box to see a tooltip with the center frequency and when appropriate, the name of the note, of the frequency band.
Smoothing
Specifies how the spectrum will be smoothed over time.
   Average
   Peak
Smoothing factor
Specifies the strength of the smoothing (0.0 to 1.0)
Peak mode
Specifies how the peak indicators are rendered.
   None
   Classic
   Gravity
   AIMP
   Fade Out
Hold time
Specifies how long a peak value will be held steady.
Acceleration
Specifies the acceleration used to modify the peak value.
Colors
Click any of the colors to modify.
External links
- Spectrum Analyzer (foo_vis_spectrum_analyzer) on
 foobar2000.org
- Discussion topic on
 hydrogenaudio
See also
- Frequency bands spectrum analyzer using either FFT or CQT on CodePen (which this component is based on)

