foobar2000:Components/Spectrum Analyzer (foo_vis_spectrum_analyzer)
This article is a stub. You can help the Hydrogenaudio Knowledgebase by expanding it.
Experimental component
This component is considered an early prototype and it is under development as it was released as an early access. Bugs and issues with this component are expected and currently it has no CUI support.
| Spectrum Analyzer | |
|---|---|
 foo_vis_spectrum_analyzer | |
| Developer(s) | |
| Release information | |
| Preview release | 0.1.0.2 (November 13, 2023; 1 year ago) |
| foobar2000 compatibility | |
| Architecture | x86 32-bit, x86 64-bit |
| Minimum version | 2.0 |
| UI module(s) | Default UI |
| Additional information | |
| Use | Visualization |
| View all components | |
A recreation of Musical Spectrum component for foobar2000 v2.x and 64-bit versions.
Configuration
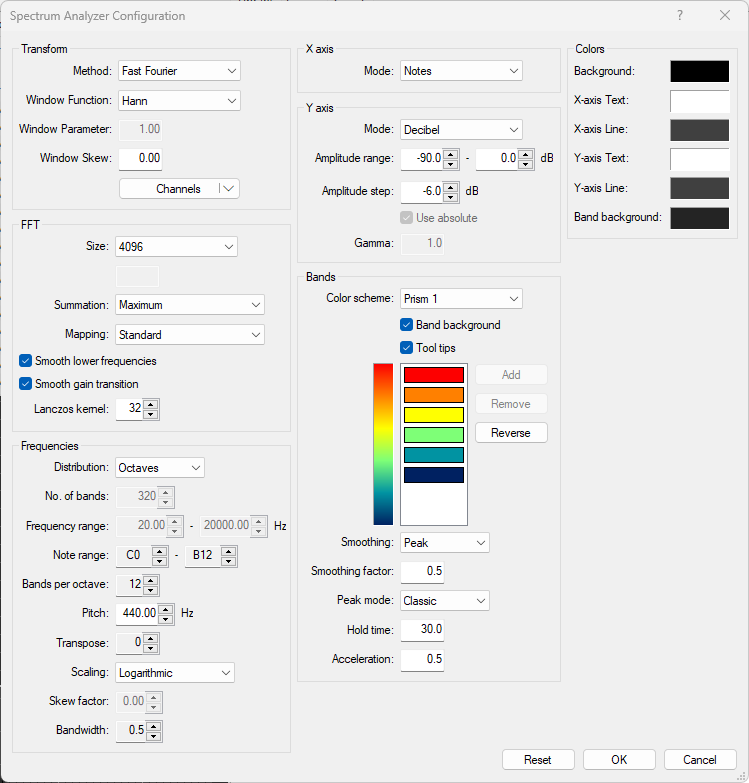
Right-click on the component window and select Configure from the context menu to open the configuration dialog.
FFT Size: An integer number between 64 and 32768. Note that any number that is not a power of 2 will consume a lot more CPU power.
Summation: Determines which method is used to sum the coefficients of FFT.
   Minimum
   Maximum
   Sum
   Residual Mean Square (RMS)
   RMS Sum
   Average
   Median
Smooth lower frequencies
Smooth gain transition
Lanczos kernel: Size of the Lanczos kernel
Distribution: Determines which parameters are used to generate the frequency bands.
   Linear: Generate frequency bands based on the frequency parameters.
   Octaves: Generate frequency bands based on the note parameters.
   AveePlayer: Generate frequency bands used by AveePlayer.
No. of bands: Number of frequency bands to generate (2 to 512)
Frequency range: Frequency of the first and last band, 0Hz to 96000Hz.
Note range: Number of the first and last note. (C0 = 0, C1 = 12, ...), 0 to 143 (12 octaves)
Bands per octave: Number of bands per octave (1 to 48)
Pitch: Tuning pitch (A4 = 440.0Hz), 0Hz to 96000Hz.
Transpose: Detuning offset (-24 to 24)
Scaling: Determines which frequency scaling function is used.
   Linear
   Logarithmic
   Shifted logarithmic
   Mel (AIMP)
   Bark
   Adjustable Bark
   ERB
   Cams
   Hyperbolic Sine
   Nth Root
   Negative exponential
   Period
Skew factor
Bandwidth: 0.0 to 64.0
X axis: Determines which X axis to display.
   Bands: Center frequency of a band, every 10 bands.
   Decades: Fixed frequency range
   Octaves: Frequency of the C note of each octave
   Notes: C note of each octave
Y axis: Determines which Y axis to display.
   Decibel scale
   Logarithmic
Color scheme: Specifies the color scheme used to render the spectrum.
   Solid color (Not configurable yet)
   Custom color scheme (Not implemented yet)
   Prism 1
   Prism 2
   Prism 3
   foobar2000
   foobar2000 Dark Mode
Smoothing: Specifies how the spectrum will be smoothed over time.
   Average
   Peak
Smoothing factor: Specifies the strength of the smoothing (0.0 to 1.0)
Peak mode: Specifies how the peak indicators are rendered.
   None
   Classic
   Gravity
   AIMP
   Fade Out
Hold time
Acceleration
External links
- Spectrum Analyzer (foo_vis_spectrum_analyzer) on
 foobar2000.org
- Discussion topic on
 hydrogenaudio
See also
- Frequency bands spectrum analyzer using either FFT or CQT on CodePen (which this component is based on)
